

Goods exports set a new record in the first four months of 2025.
In the first four months of the year, Vietnam’s exports surpassed USD 140 billion – the highest ever. Total import-export turnover surged to over USD 276 billion.
According to information from the General Department of Customs, the total value of Vietnam’s import-export activities in April 2025 reached USD 74.31 billion, a decrease of 1.4% compared to the previous month. Of this, exports fell by 2.8% to USD 37.44 billion, while imports remained nearly unchanged from March at USD 36.87 billion. The trade balance posted a surplus of USD 570 million, marking a sharp decline compared to the earlier months of the year.
For the first four months as a whole, the total import-export turnover reached USD 276.89 billion, an increase of 15.7% compared to the same period last year. Exports accounted for USD 140.34 billion (up 13%), while imports totaled USD 136.55 billion (up 18.6%). However, the trade surplus dropped significantly to USD 3.8 billion, down 58.2% from the USD 9.05 billion recorded in the first four months of 2024.
Domestic enterprises continued to make strong gains, with higher growth rates in import-export activities than foreign direct investment (FDI) enterprises. The total import-export turnover of the domestic sector reached USD 92.51 billion, up 19.2% year-on-year. Specifically, exports reached USD 41.25 billion (up 16.8%) and imports were at USD 51.26 billion (up 21.1%). Meanwhile, the FDI sector recorded a total import-export turnover of USD 184.38 billion (up 14%), still holding a large share but with slower growth.
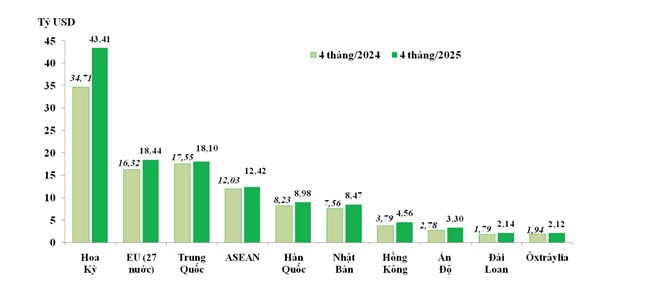
Top 10 Export Markets of Vietnam
The United States remained Vietnam’s largest export market, with a turnover of USD 43.41 billion, up by a strong 25.1%. This was followed by the EU (USD 18.44 billion, up 13%) and China (USD 18.1 billion, up 3.1%). On the import side, China continued to be Vietnam’s largest supplier, accounting for 39% of total import value with a 26.5% increase, reaching USD 53.16 billion. The most notable imported product groups from China included electronic components, machinery and equipment, textiles, and mobile phones.
Although April’s export figures saw a slight decline, the cumulative export turnover for the first four months still reached a record-high of USD 140.34 billion. Notably, computers, electronic products, and components led all export groups, reaching USD 29.26 billion, an increase of 36.2%. This group accounted for 21% of total export value and saw strong growth in multiple markets, such as the United States (up 57.6%), South Korea (up 42.3%), and the EU (up 32%).
Exports of textiles, footwear, toys – sports goods, and wooden products all recorded good growth. Footwear exports reached USD 7.6 billion (up 14.5%), with the U.S. and EU markets accounting for 63% of the total. The category of toys, sports equipment, and parts surged by 83.6%, reaching USD 1.77 billion, with the U.S. market alone making up nearly two-thirds of the value.
On the downside, mobile phones and components – a key export product group – declined by 1.9% in value compared to the same period last year, although they still reached USD 17.8 billion. Rice exports also dropped sharply in value (down 13.3%) due to a nearly 20% drop in average price, despite a volume increase of 8.1%.
Total import value over the four-month period reached USD 136.55 billion, up 18.6%. Among this, computers, electronic products, and components showed the strongest growth, reaching USD 42.88 billion (up 35.4%), accounting for nearly one-third of total imports. China, South Korea, Taiwan (China), and Japan together supplied 81% of this product group.
Machinery and equipment also saw a sharp rise of 24.3%, reaching USD 17.58 billion. Other groups such as base metals, plastic materials, and textile – leather footwear materials and accessories all experienced significant increases in both volume and value of imports.
Conversely, some product groups such as steel and fuel saw declines in import value due to reduced average prices, despite increased volumes. For instance, fuel imports including coal, crude oil, and gas reached over 33 million tons, but their value fell by nearly 10% compared to the same period.
Remarkably, imports of completely built-up (CBU) automobiles surged by 48.5%, reaching nearly 65,000 units in the first four months. Vehicles imported from Thailand, Indonesia, and China accounted for the largest share.
Please don’t hesitate to contact if you have anymore questions!
Mr. Jimmy
General Manager TPG
(+84)-(0)903917505